How big is the alternative data market for investment managers?
Daryl Smith, CFA, Head of Research (London)

Executive summary
The alternative data market for investment management has grown significantly over the past few years, reaching a minimum of $2.5 billion in annual spending by 2024. Using data from Neudata’s proprietary research catalogue as a proxy to estimate the market, this report quantifies spending trends, identifying key drivers such as strong buyer demand and a surge in dataset availability.
Market growth has averaged 21% per year since 2020, with a sharp acceleration to 33% in 2024. Web-scraped and transactional datasets continue to dominate the market, though spending on globally applicable datasets has risen sharply. The average dataset generates approximately $1.1 million per year, but revenue distribution is uneven, with a proportion of high-earning datasets driving much of the market’s value.
Despite strong growth, the market faces key uncertainties. Regulatory and compliance risks, such as evolving privacy laws and increased scrutiny from financial regulators, could impact data accessibility and costs. Additionally, vendor churn remains a concern, with datasets being discontinued due to regulatory challenges or business failures. AI-driven advancements present both opportunities and risks—enhancing datasets and creating new revenue streams while also increasing competition and enabling firms to build proprietary datasets in-house.
Looking ahead, the alternative data market is poised for continued expansion – Neudata estimates a market size of $3.3 billion to $15.4 billion in 2025, with spending potentially reaching between $8.6 billion and $ 39.9 billion by 2030, depending on various assumptions. The market’s trajectory will largely depend on buyer demand, regulatory developments and technological advancements. While challenges remain, the sector’s strong growth trends and increasing adoption by new investment firms suggest a positive outlook for the years ahead.
Our methodology
To calculate the market size, we used the following structured methodology:
- Data selection – We selected all full (Neudata analyst-written and vendor-published) alternative data reports on the Neudata platform that include estimates for a) The number of investment clients using the dataset and b) The price of the dataset
- Client count estimation – We assigned a client count based on Neudata’s crowding factor score. If a range was provided, we used the midpoint. For instance, if a dataset was rated as having 6-10 investment clients, we assumed eight distinct buyers purchased it.
- Pricing estimate – Instead of taking the midpoint of the vendor-provided price range, we estimated the average price paid using a weighted approach. Specifically, we assumed the price sits at 30% along the provided range rather than the midpoint. For example, if a dataset’s price range is $26k–150k, the estimated average price is $63.2k based on the formula:((max−min)×0.3)+min. We validated this method by manually reviewing a sample of reports with qualitative pricing insights, which confirmed that actual transaction prices tend to cluster below the midpoint. We validated this method by manually reviewing a sample of reports with qualitative pricing insights, which confirmed that actual transaction prices tend to cluster below the midpoint.
- Spending calculation—For each dataset, we multiplied the estimated number of buyers by the estimated average price to derive an annual spending estimate. Using the example above, the annual market spend for this dataset would be estimated as 8×$63.2k=$506k/yr.
- Market adjustment—We aggregated spending estimates across all datasets with available data and then applied a proportional adjustment to account for datasets where figures were incomplete. This yielded a total estimated market size based on the full set of reports listed on the Neudata platform.
For the avoidance of doubt, the following is not in scope:
- Data spending outside of data purchasing (e.g. infrastructure, headcount, cloud services)
- Data spending outside of investment management
- Reports labelled as ‘traditional data’ on the Neudata Scout platform
Key findings
Total spend reached at least $2.5bn in 2024
Using the methodology above, we included 2,338 datasets in our analysis. Within this universe, we estimate alternative data spending to have reached $2.5bn/yr by the end of 2024.
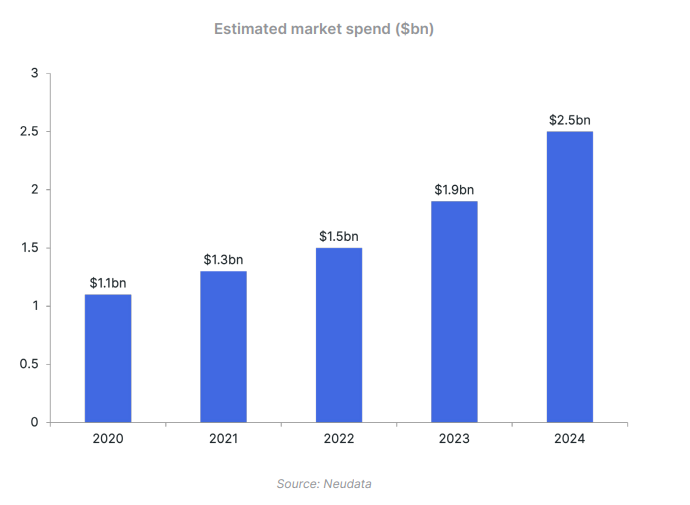
Market spending growth has been strong, averaging 21% annually since 2020, with the most notable acceleration occurring in the past two years. Growth surged to 26% in 2023 and 33% in 2024, far surpassing the 15% and 13% increases in 2021 and 2022, respectively.
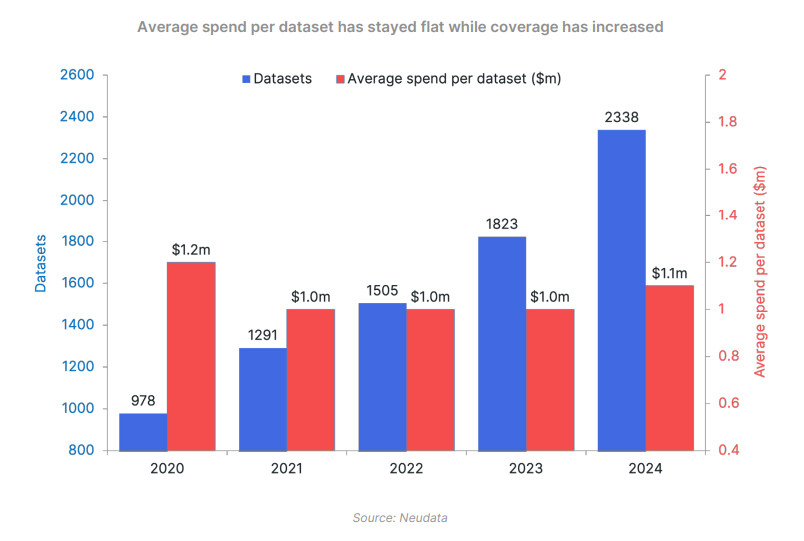
The main driver of this growth has been new datasets added to Neudata’s coverage (from 978 reports in 2020 to 2,338 reports in 2024). This has grown at an average rate of 24% per year and has predominantly resulted from new vendors listing on Neudata rather than existing vendors listing new products. This strong supply-side growth has been coupled with equally strong buyer demand.
Web-scraping and transactional datasets remain the market leaders
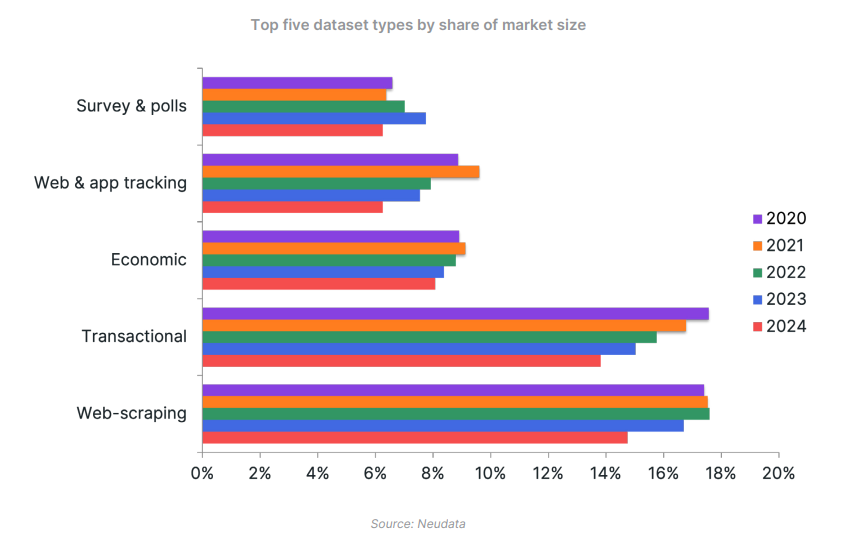
Since 2020, web-scraped and transactional datasets have consistently accounted for the largest share of spending on the Neudata platform. By the end of 2024, these dataset types made up 15% and 14% of market spend, respectively—slightly down from their 17% and 18% shares in 2020.
One nuance: Many datasets categorised as “web-scraping” also overlap with other dataset types.
By contrast, transactional datasets tend to stand alone with minimal cross-categorisation. This reinforces our view that transactional data plays a dominant role when measured by total dollars spent in the alternative data space.
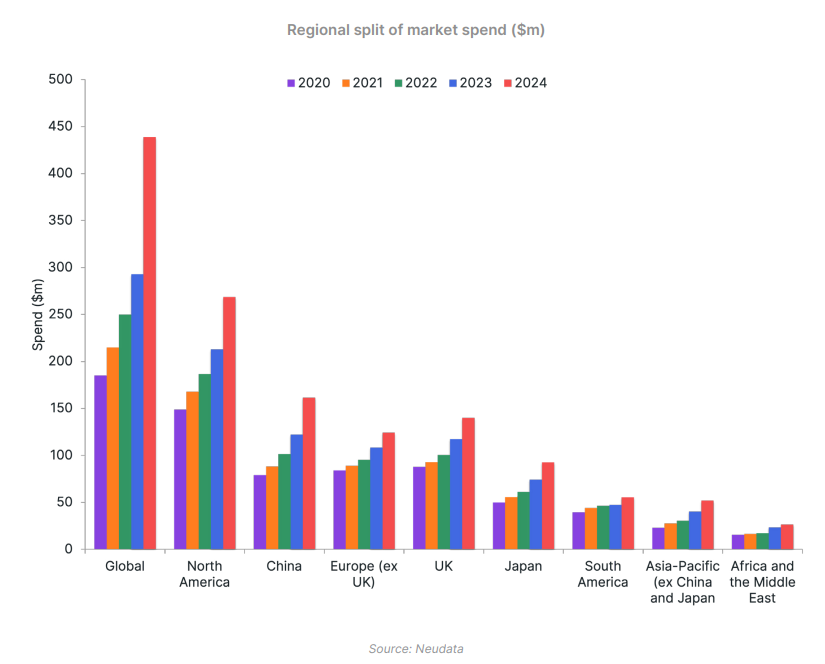
Market spend on global datasets is increasing faster than any given region
Back in 2020, datasets with global applicability accounted for 26% of all datasets on Neudata’s platform. Today, that figure has grown to nearly a third, with an estimated $439m in total spending going toward globally applicable datasets.
We believe multiple factors are driving this shift, including:
- A higher proportion of new datasets added to the Neudata catalogue having global applicability.
- Vendors expanding the geographic reach of their products.
The average dataset generates $1.1m/yr, but that’s misleading
By dividing the estimated $2.5bn market size by the 2,338 datasets included in our analysis, we estimate the average dataset (as of 2024) earns $1.1m/yr.
Interestingly, this figure hasn’t changed notably from 2020-2024 as the alternative data market(and therefore number of datasets entering the market) has grown considerably.
However, one could argue that the above averages are misleading, given that many datasets listed have an estimated market spend of $0.This is because the sample includes vendors which are:
- Well established in the investment vertical but releasing new products that have yet to be purchased by investment users.
- Successful in selling datasets to other industries but are yet to explore the investment vertical.
- Offering freely available datasets, meaning there is no price tag.
Excluding these non-revenue-generating datasets, the estimated average spend per dataset in 2024 increased to $1.6m.
Revenue ranges across datasets are vast
While $1.6m is a useful benchmark, revenue distribution across datasets is highly uneven. Most notably, we estimate a large subset (415 datasets) earn between $0.1 m and $0.5 m.
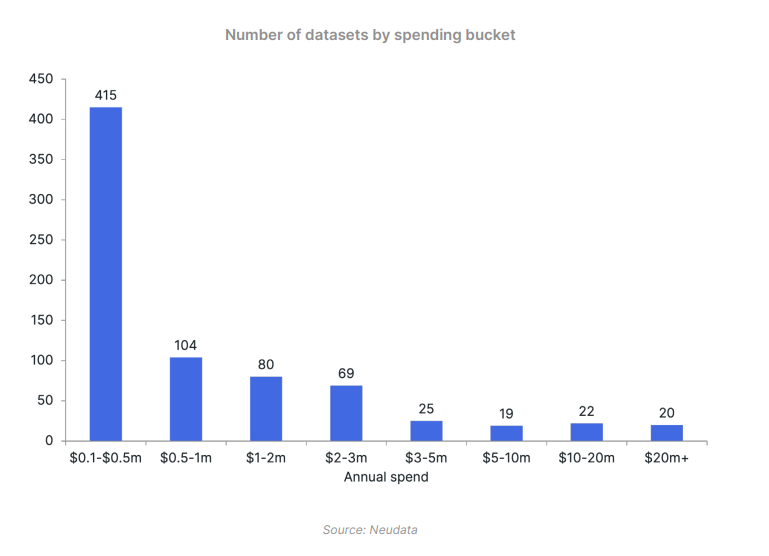 Additionally, a small subset of datasets earn considerably more than our $1.6m average figure, with 20 datasets generating over $20m/yr from investment firms alone.
Limitations and sensitivities
We recognise several limitations and sensitivities in our market sizing analysis, most notably:
- Potential vendor bias—Our primary sources for pricing and client data are the vendors themselves. However, not all vendors disclose accurate or complete information. Some may provide a headline price to Neudata that is later negotiated down by buyers, sometimes significantly.
- While we’ve attempted to account for this in our pricing estimates, the margin for error is large. Additionally, our midpoint assumption for client numbers (see section 2 of the methodology) could also lead to an inaccurate estimation of total market spending.
- Missing data adjustments – Many vendors have not disclosed both their pricing and the number of investment clients for each product. In cases where this information is unavailable, we have extrapolated our market sizing using proportional adjustments based on available reports.
- Incomplete coverage – Our estimates only cover alternative data products that have an analyst-written or vendor-submitted report on Neudata Scout. This means we have, up to this point in our analysis, excluded:
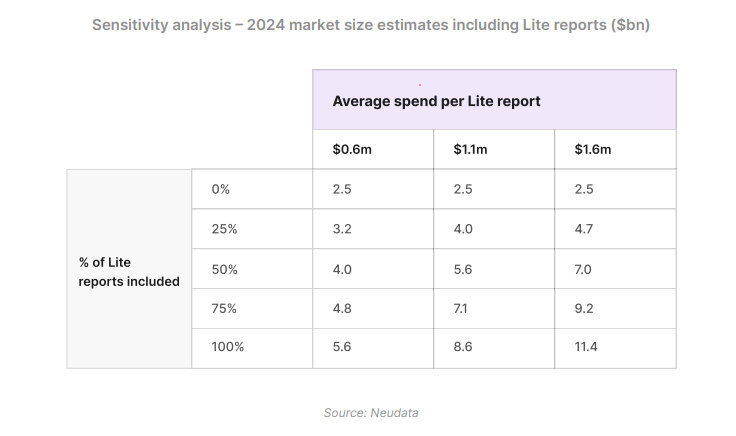
a) All Lite reports in our catalogue.
At the time of analysis, the Neudata platform lists approximately 5.6k Lite reports, which include basic information about a dataset but are missing key details like pricing, client adoption, and whether the vendor actively sells the dataset for investment use. These datasets were left out of our methodology because without this information, producing an accurate spending estimate for each product wasn’t feasible.
By omitting these datasets and holding all else equal, our estimate of annual alternative data spend is likely very conservative. This exclusion may also help explain why our spending figures are lower than those of other industry reports.
To demonstrate this, if all 5.6k Lite reports are added to our market sizing estimate, and it is assumed that each of these datasets is generating $1.6m of revenue each year (the average figure calculated above), our 2024 estimate for the size of the alternative data market balloon from $2.5bn to $11.4bn. Other scenarios are shown below, where ‘% of Lite reports included refers to the percentage of the 5.6k lite reports that are added to the market sizing calculation.
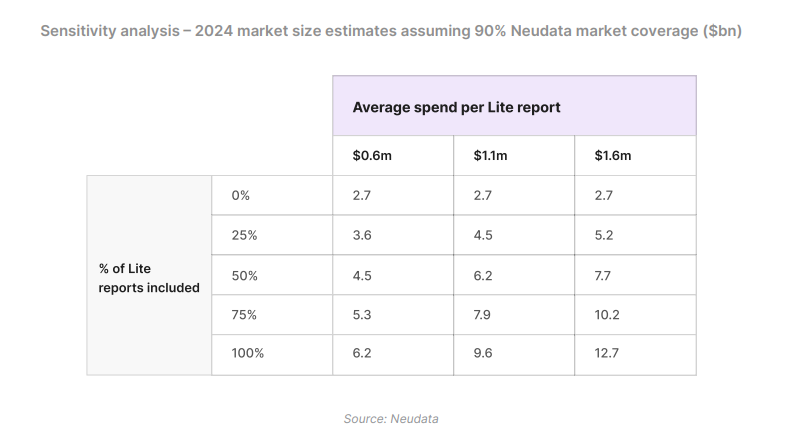
b) Alternative datasets without a presence on Neudata that are purchased by investment managers
At Neudata, we strive to cover the full spectrum of alternative datasets purchased by investment professionals worldwide. However, a portion of datasets—and the associated spending—fall outside our catalogue.
If we assume that Neudata’s catalogue reflects 90% of investment managers’ total alternative data spending, our market size estimates would need to be revised upward to capture the full scope of the market. Under this assumption, our 2024 market size projections from the sensitivity analysis would range from $2.7bn to $12.7bn, depending on the assumptions applied.
Despite these limitations and sensitivity challenges, we believe our approach provides a reasonable estimated range of market spending while acknowledging inherent uncertainties.
Future gazing
Perhaps the biggest uncertainty of all is what’s in store for the alternative data market in the coming years.
If we assume the market’s average growth rate between 2020 and 2024 persists (21% CAGR) up to and including 2030, our estimated market spend will grow to anywhere between $8.6bn and $39.9bn, depending on the assumptions taken from the above sensitivity analysis. This range effectively represents a ‘bear vs. scenario for the alternative data market, as outlined below.

However, the market size will be determined by a variety of factors, such as:
- Buyer demand – Our September 2024 Future of Alternative Data report suggests that, in the near term, there is optimism for data budgets, with 95% of data buyers telling us they expect their budgets to increase this year. Data sellers are also similarly upbeat. However, perhaps the most significant shift in alternative data market spending over the next 3-5 years will come from funds that have yet to be used for alternative data. Rapid adoption by such funds in the coming years could mean our 21% CAGR assumption is overly conservative.
- Regulation and compliance risks—Privacy laws could tighten access to consumer data, while the US Securities and Exchange Commission and other global financial regulators may scrutinise how funds use alternative data. This may significantly impact compliance costs and make using alternative datasets less appealing.
- Data access – Vendor churn (e.g. datasets being discontinued due to regulation or business failure)remains a risk. At the time of this report’s publication, around 450 reports were labelled as discontinued on the Neudata platform, fewer than 100 of which had been labelled as discontinued in the past year. We wouldn’t be surprised to see this rate of discontinuation increase in the coming years.
- The AI question mark – AI advancements could be a double-edged sword for data sellers in the investment space. On the upside, AI could enhance existing datasets, allowing vendors to charge a premium and even enable the creation of entirely new, high-value data products tailored to investors. On the downside, AI might lower barriers to entry, increasing competition from new vendors. Additionally, some investment firms may leverage AI to build certain datasets in-house, reducing their reliance on external providers. This could be a significant risk for vendors that collect and process data from readily available public sources.
The future of alternative data: Opportunity and uncertainty
The alternative data market has grown rapidly, with our analysis suggesting that spending has grown by an average of 21% YoY since 2020 and increased to a growth rate of 33% in 2024 alone. Web-scraping and transactional datasets dominate, but rising demand for global datasets reflects shifting buyer needs. Spending remains concentrated, with a small proportion of ‘blockbuster’ datasets driving much of the market’s value.
Competing forces will shape future growth. Expanding buyer demand—especially from firms new to alternative data—suggests further upside. Yet regulatory scrutiny, vendor churn and AI-driven disruption introduce uncertainty. While AI could enhance datasets and unlock new revenue streams, it also lowers entry barriers and may push firms to build datasets in-house, challenging existing vendors.
If current trends hold, we believe market spending will continue to grow at 20%+ per year. However, this growth will depend on how vendors, buyers and regulators navigate these shifts. For data sellers, staying competitive will require innovation and adaptability.
While this analysis serves as a proxy for alternative data spending rather than a precise measure, it affirms our view that the investment vertical's spending on alternative data will likely continue on a strong growth trajectory in the coming years.