From patents to profit: Predicting stock market success
Reyna Eapen, Research Analyst

Tech giants continue to dominate the innovation landscape, securing the lion's share of patents issued in 2024. We review a paper that explores the relationship between tech company patent activities and stock market performance, going beyond traditional stock forecasting. The authors model the number of applications, the diversity of patent categories and their impact on stock price dynamics and volatility.
LITERATURE
We review the 2015 paper ‘The Impact of Patent Activities on Stock Dynamics’ by Constantine Vitt and Hui Xiong.
QUICK VIEW
The paper explores the relationship between patent activity and stock market performance for high-tech companies, using stock trading and patent data. The authors analyse 418 companies (including major NASDAQ, NYSE and foreign tech companies) and carve out a subset with significant patent activity. January 2013 (two years before the study) was the cutoff for the analysis. The influence of general market performance is filtered out, so the analysis can focus solely on the impact of patents. Both the number and diversity of patents are considered, with an emphasis on patent activity that diverges from a company’s usual tech area. The analysis also incorporates various time lags to account for the delayed impact of patents on stock performance. The study found that companies expanding their patents into new areas experience higher stock price volatility. Volatility was more sensitive to patent activity than drift (average return change). Overall, the authors conclude that investors seeking a long-term perspective on tech companies could incorporate patent data for perspectives beyond traditional financial metrics.
THE DATA
The authors chose stock trading data from 418 companies and patent data from the US Patent and Trademark Office, accessed through Google Patents. This dataset contains information on patent assignments, including the application date, grant date, and classification codes (USPC codes).
The data was filtered for companies with at least 10 years of stock trading data and patent activity before January 2013. 170 of the selected companies were chosen for the analysis, which accounted for 82% of the total patents (775k+). Daily closing prices were extracted from the NYSE and the S&P 500 index to calculate daily log returns. The data was aggregated into monthly counts of patents and their classifications, distinguishing between ‘innovations’ (patents in new technological areas for the company) and ‘traditional’ categories (patents in areas where the company has existing expertise). By using the CAPM model (which calculates expected return based on the risk-free rate, the stock's beta, and the market risk premium) to adjust for market influences, they isolate a company's unique stock performance, revealing patent activity contributes to its individual stock behaviour. Since the impact of patents is not immediate, the authors included lagged terms in their models – they looked at the relationship between previous patent activity and current stock performance.
KEY FINDINGS
The study reveals a non-linear relationship between patent activity and stock volatility, implying that more complex models may be needed to make useful predictions. While recent technologies like generative AI may have impacted the model's applicability, the core principles of the study – that patent activity offers valuable stock market insights and that different types of patents can drive speculation or stability - likely still hold true. The authors noted that:
Lagged patent activity, specifically the number of patent applications and the diversity of patent categories in previous months, significantly impacted stock volatility. Innovations induced investor speculation, while traditional patent categories stabilised stock prices. The number of unique patent categories, particularly innovations, had a significant influence on stock volatility. Companies with broader patent portfolios exhibited higher market volatility. Linking patent activity to stock prices can help us better understand stock volatility, which traditional models may miss.
Patent characteristics versus stock characteristics
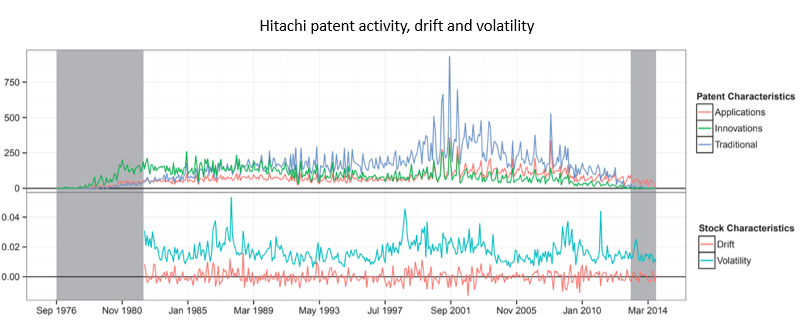 Hitachi patent activity, drift and volatility
Source: Vitt and Xiong
From the graph, the authors visually certify that periods, where the ‘Innovations’ (green) line is high, coincide with periods of higher volatility (light blue) in the stock price. This supports the idea that when a company ventures into new technological areas, it can create more uncertainty, and therefore volatility, in the market.
Limitations
Recognising that recent patent data might be incomplete because it takes time for patents to be granted, the authors focused on patents granted before January 2013 (the study was in 2015). They also discovered that many companies did not have enough patents to analyse, so they narrowed their focus to 170 companies with significant patent activity. Due to this:
The results may not apply to all high-tech companies. The results may not be replicable in a live trading environment, since the study focused heavily on historical data that was lagged. While the number of patents and categories are analysed, the study does not differentiate between highly impactful and commercially valuable patents and those less so. The study is from 2015, since which the advancement of new technologies such as generative AI, may have altered the market landscape and model’s performance.